Here’s the graphs from my recent experiment, and here’s the data.
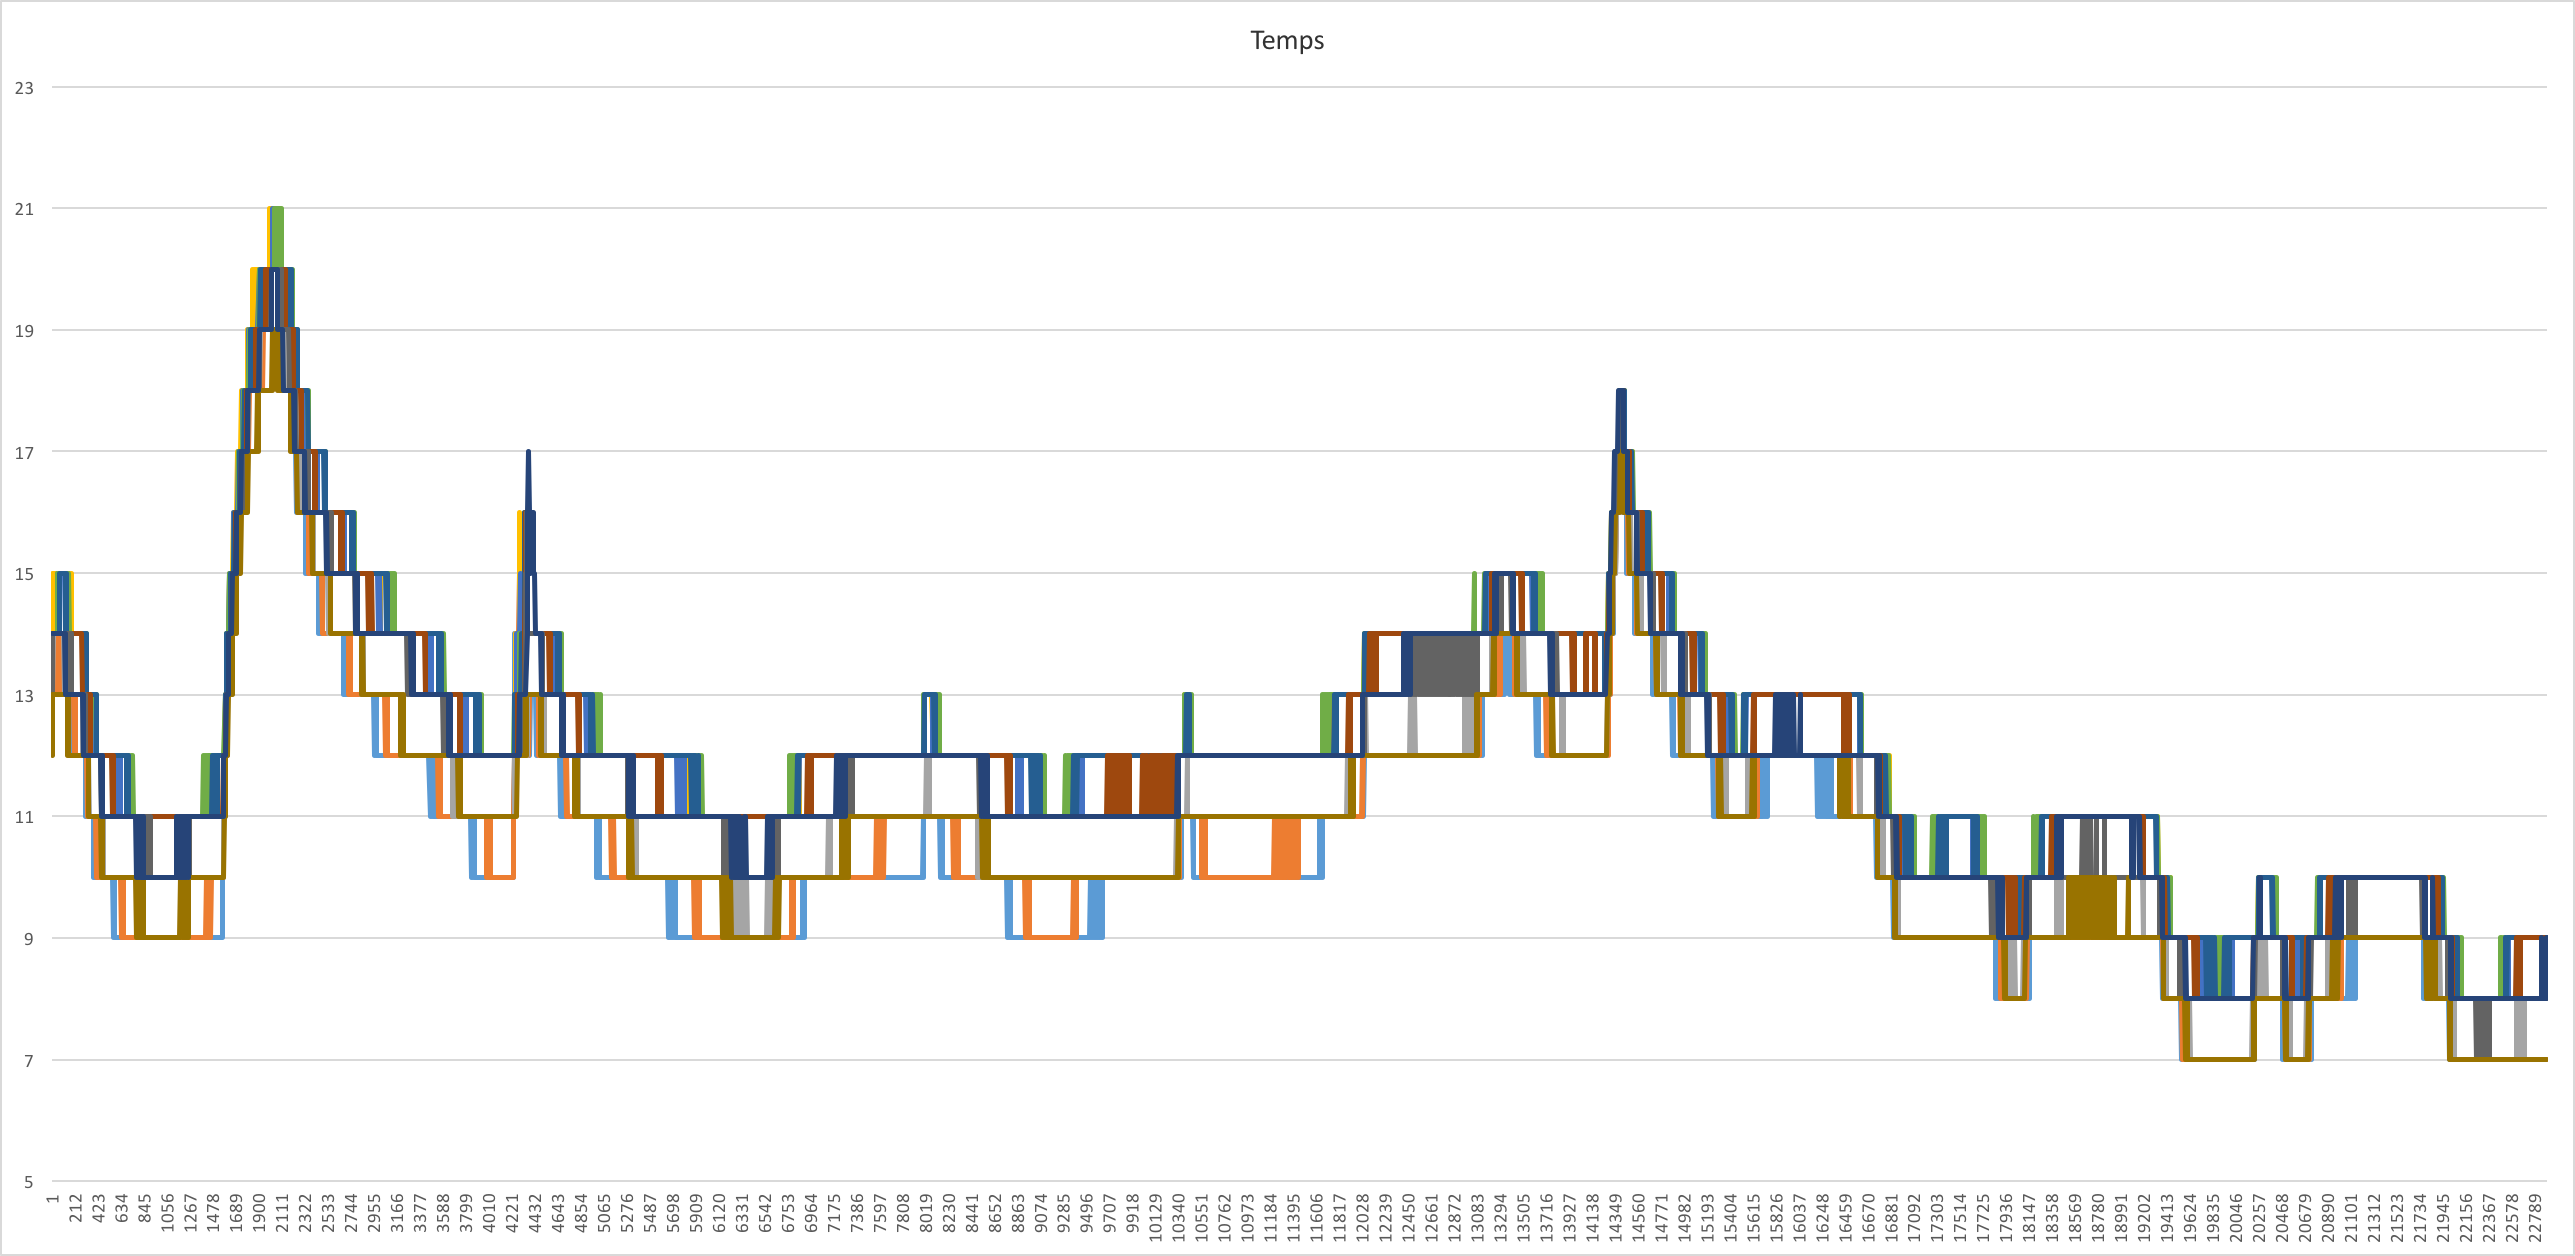
Temperature from 11 DHT11 sensors over 22900 data readings for each sensor
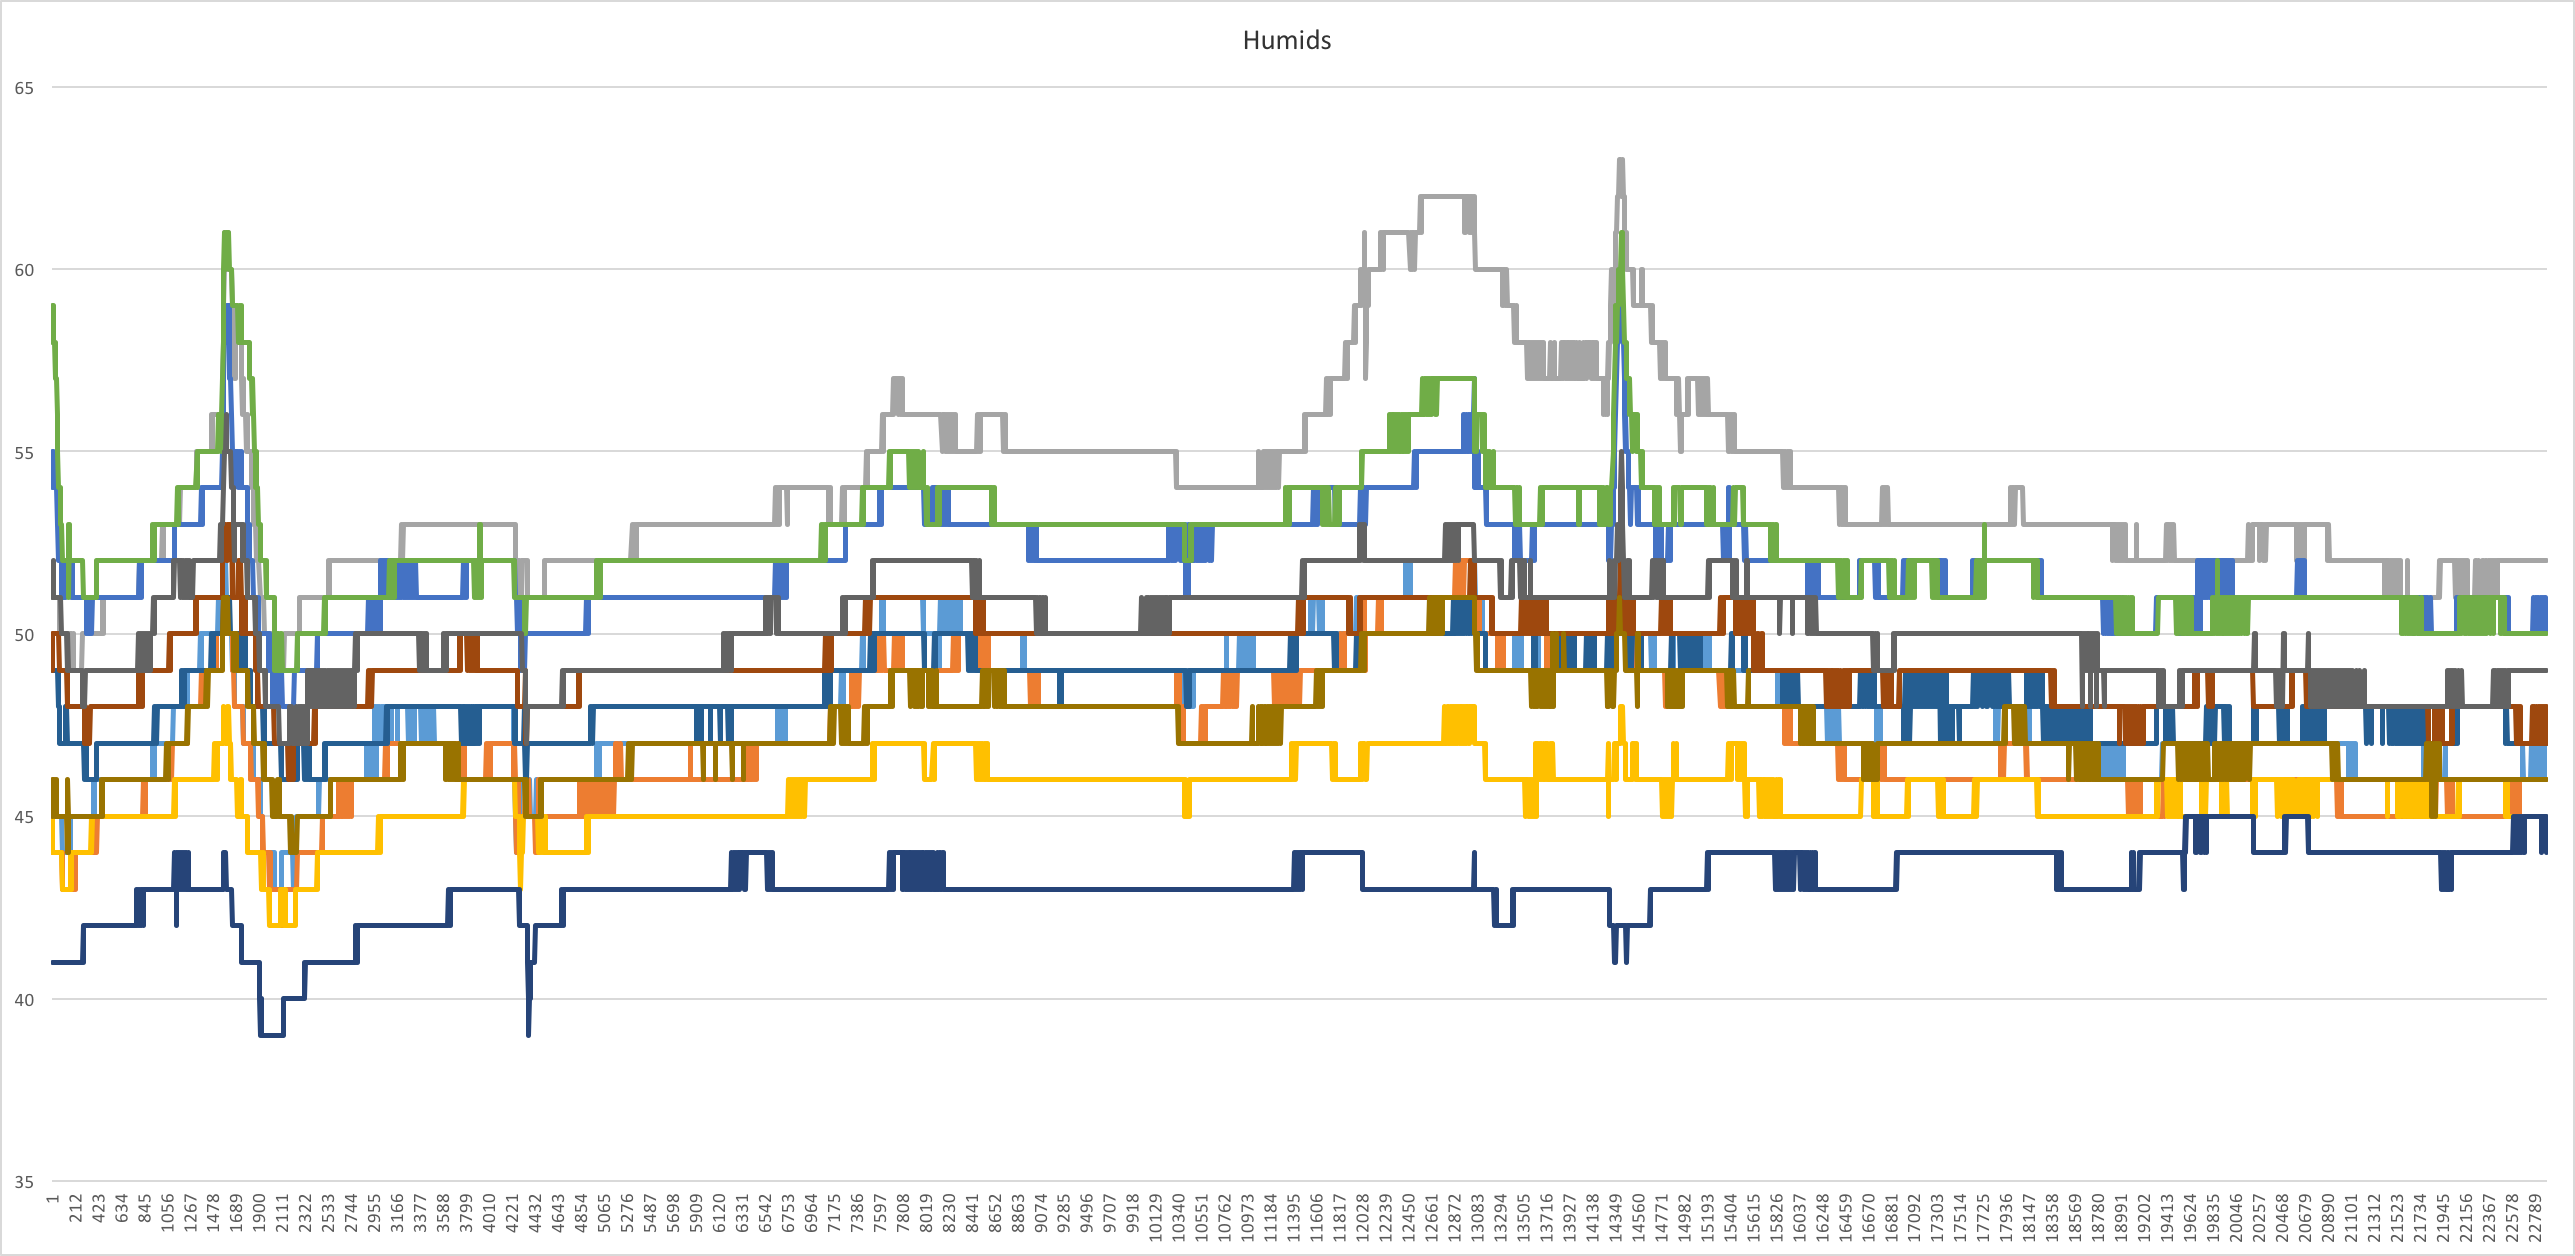
Humidity from 11 DHT11 sensors over 22900 data readings for each sensor
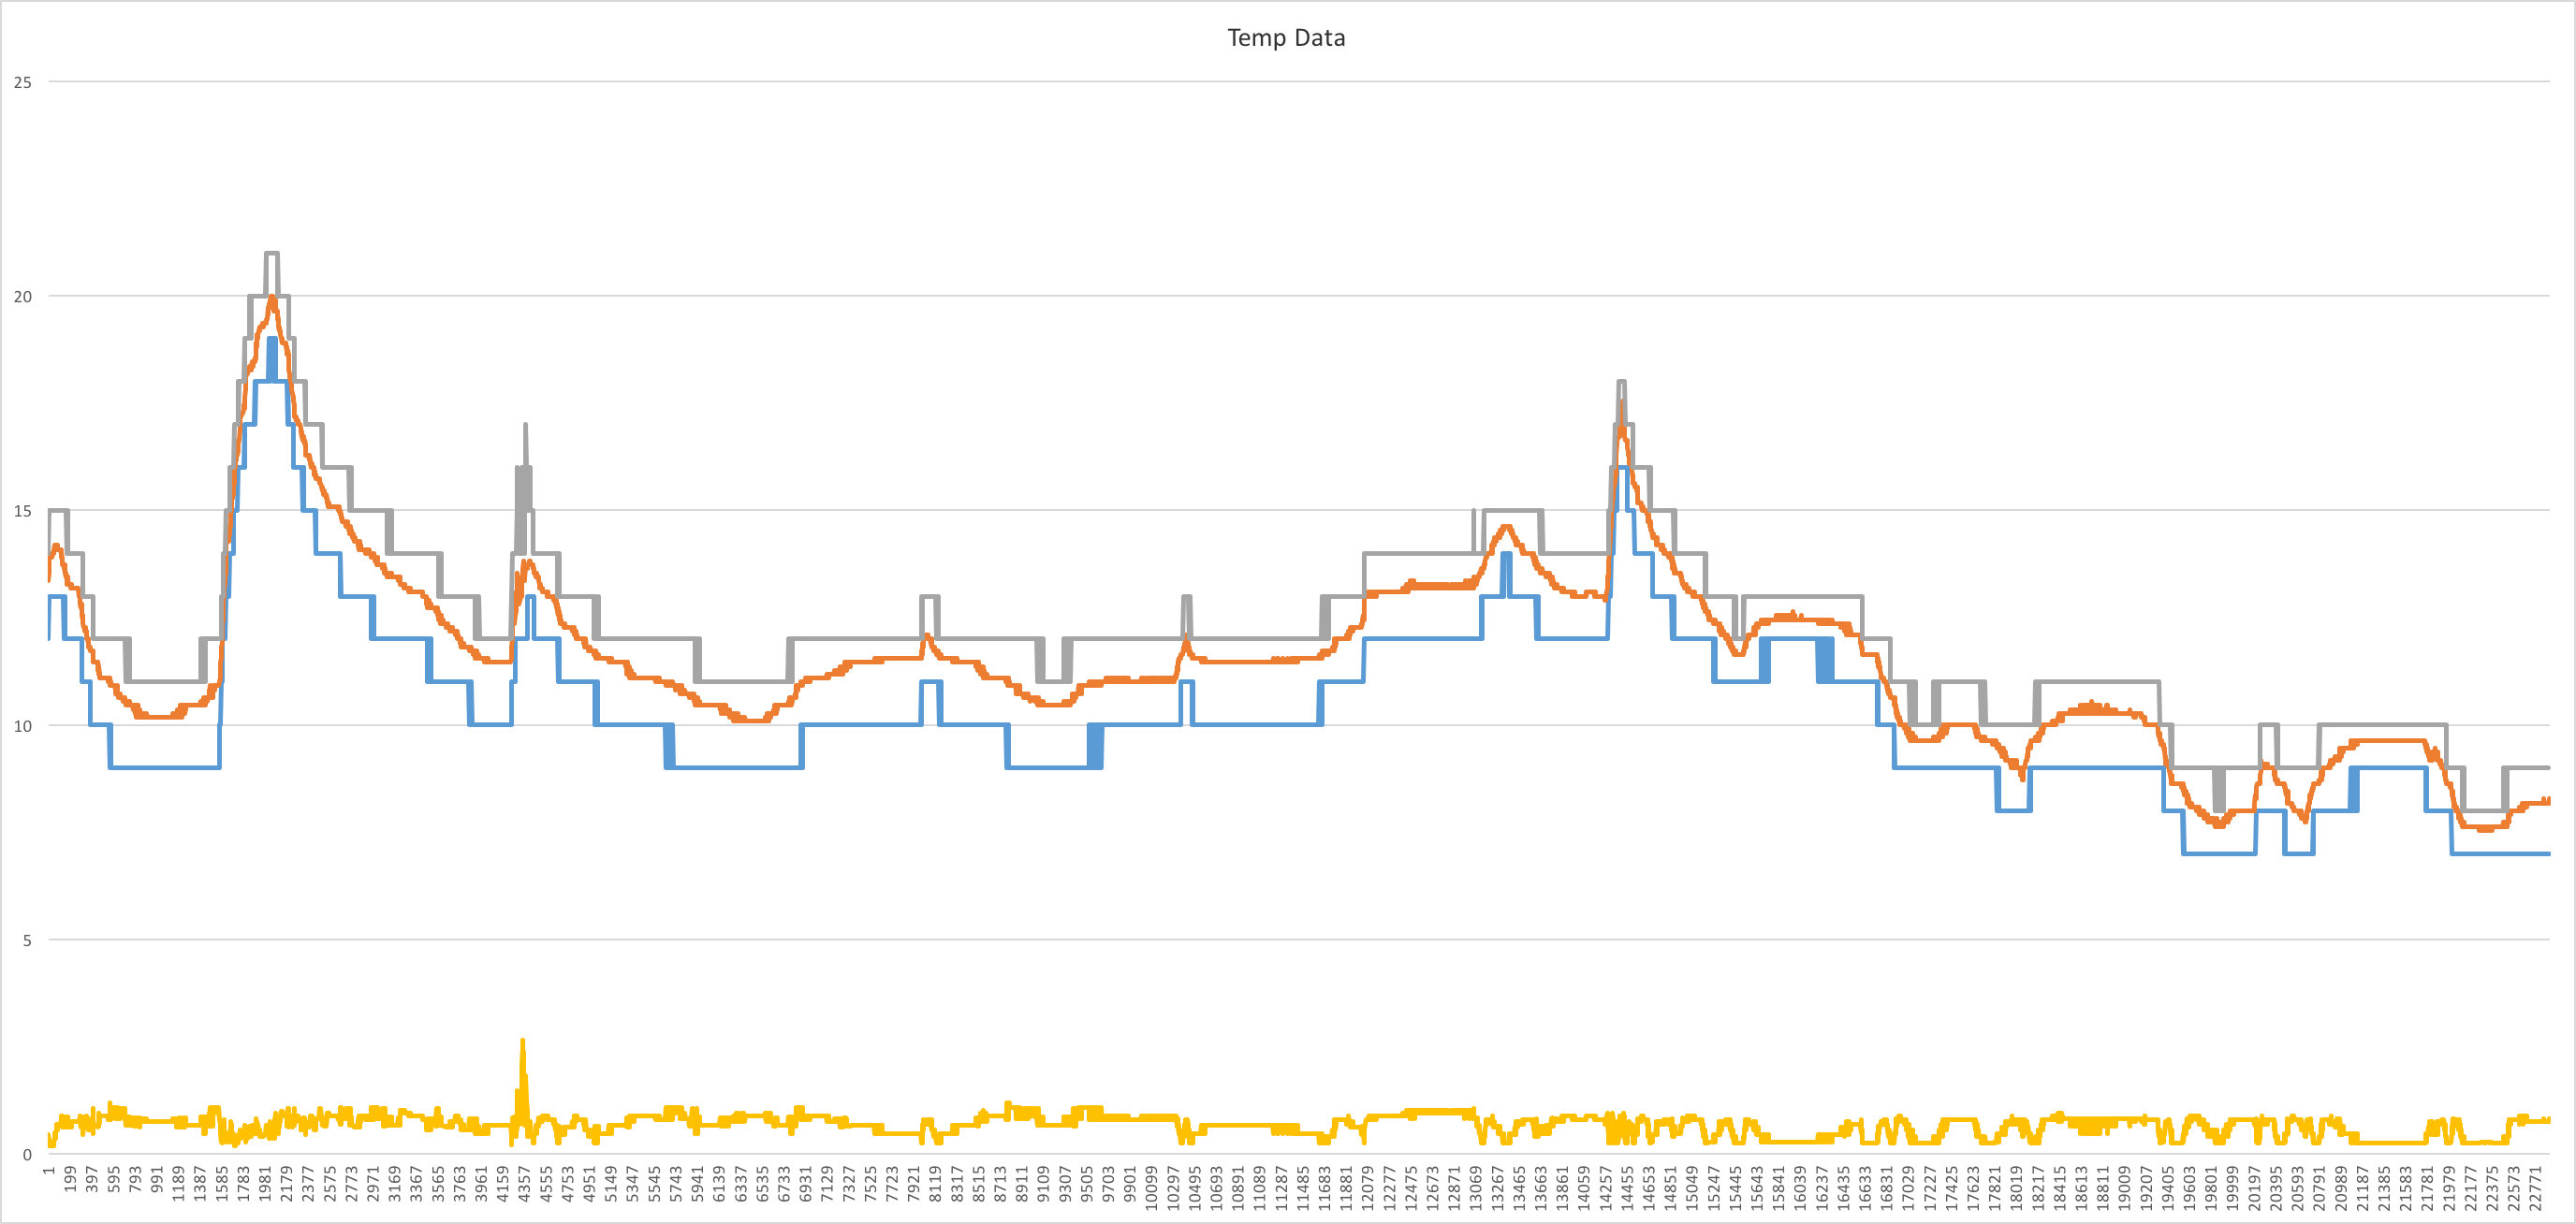
min, avg, max and variance of temperature from 11 DHT11 sensors over 22900 data readings for each sensor
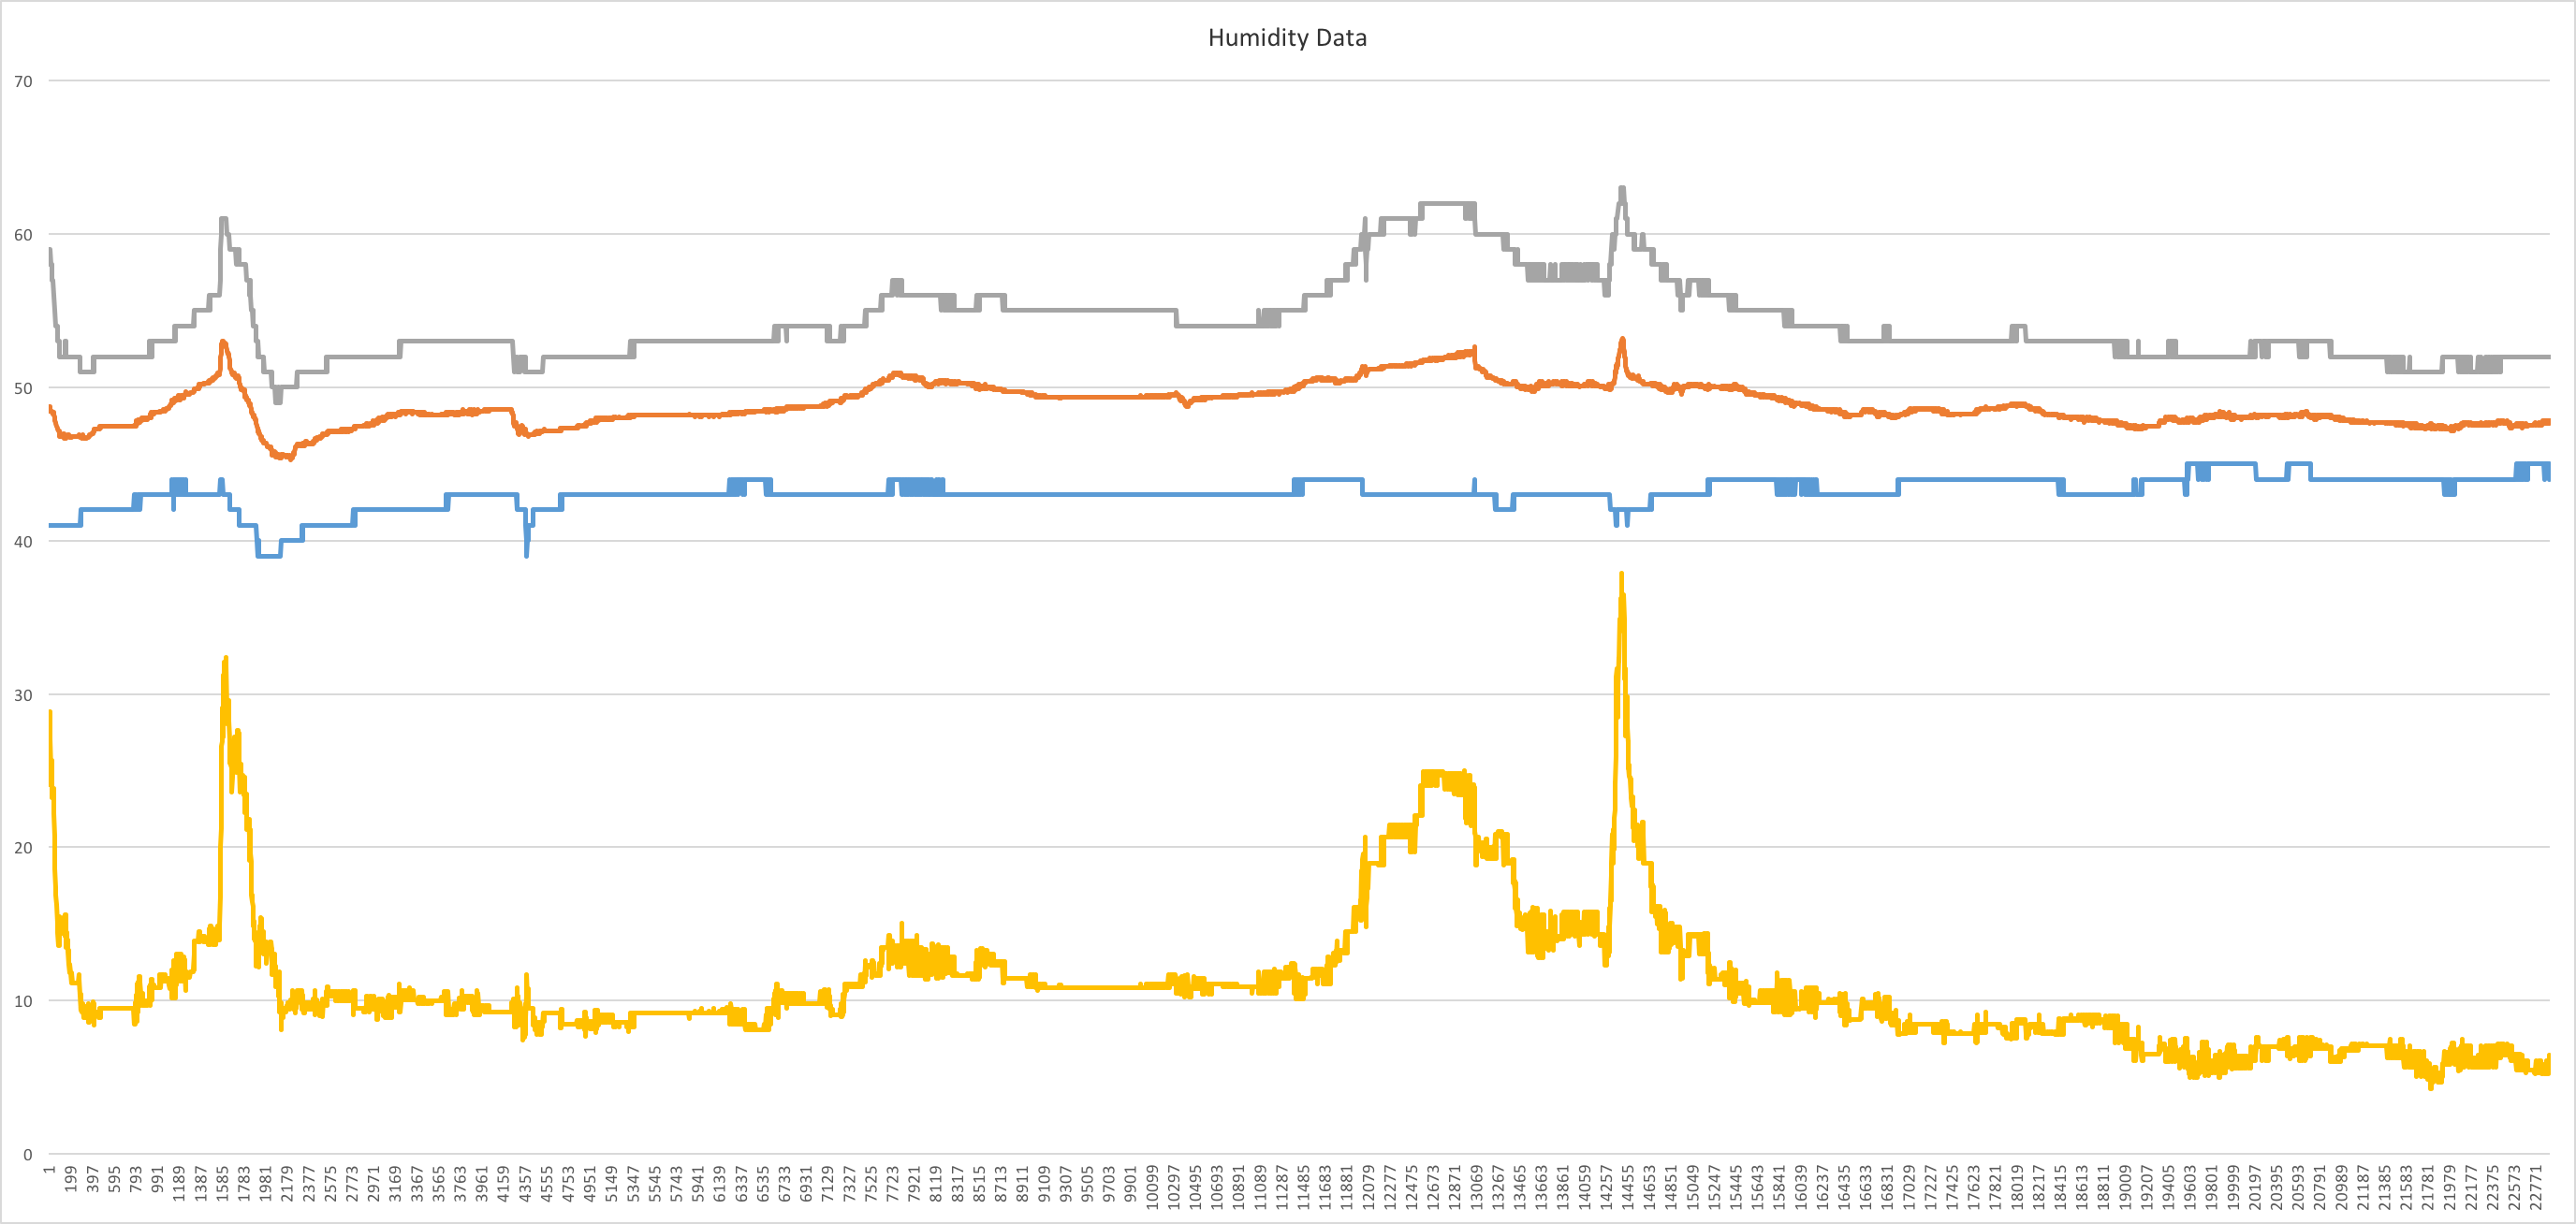
min, avg, max and variance of humidity from 11 DHT11 sensors over 22900 data readings for each sensor
and a brief video…